In 8th grade, I had the idea for a mathematical theory: 01 Theory. The basic idea is that if you analyzed all numbers, from negative to positive infinity, and counted the number of "1"s and "0"s that appeared in the numbers (for example, 10165 has two "1"s and one "0"), the ones would not only outnumber the zeros, but by an infinite amount.
This is due to the simple fact that a number can start with a 1 but not a 0. In any place that a 0 can appear, a 1 could take its place, but this is not correct the other way around, due to the fact that a number can start with a 1. As a result, there will be an infinite number more ones than zeros.
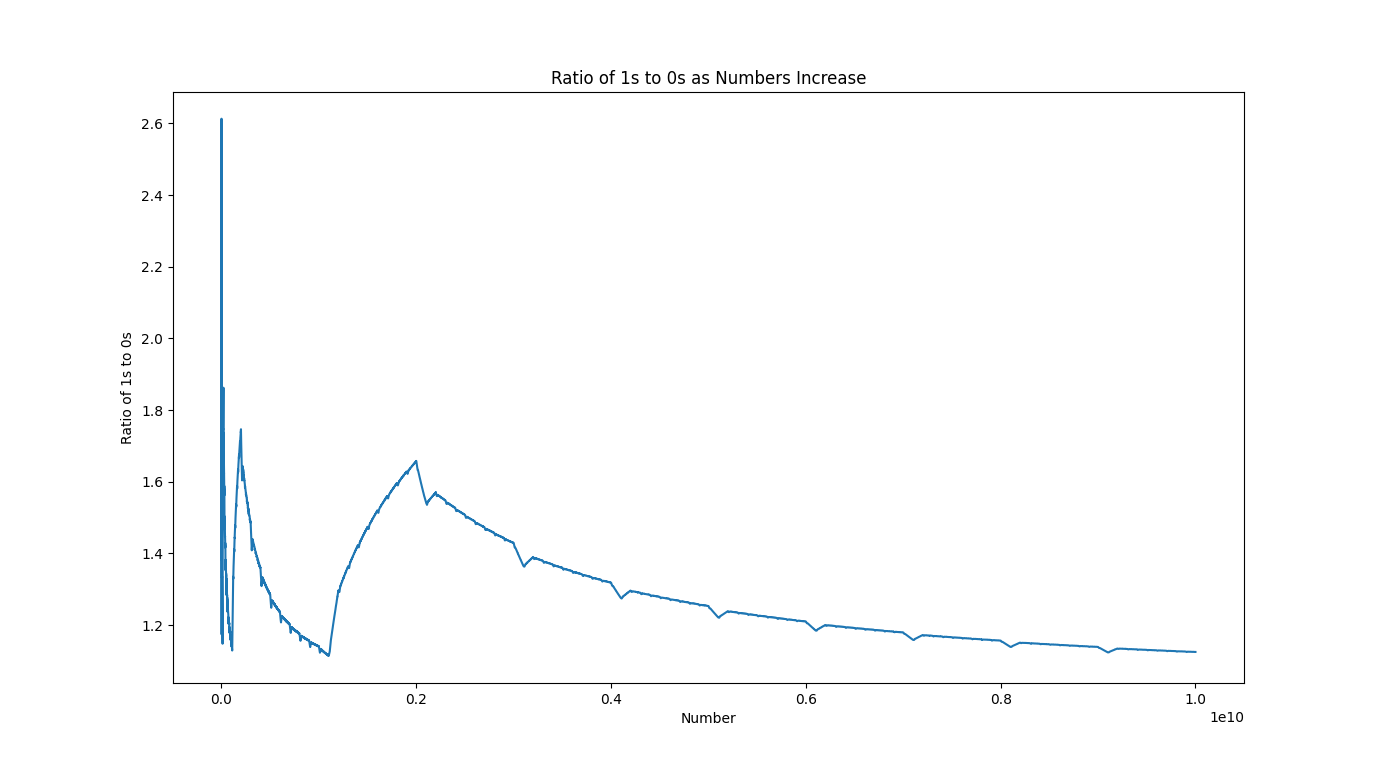
Using my new programming skills, I coded a program in Python that analyzes the ratio between 1s and 0s and uses MatPlotLib to create a graph. The graph can be seen above. As can be seen, the ratio always remains above 1, as there will always be more ones than zeros; however, the graph tends downward (toward an asymptote of 1) as the numbers get larger.
Analysis
The reason the ratio is above 1 at all is because of the first digits of numbers. Without the first digits, the ratio would be exactly 1, as the number of ones would equal the number of zeros. The first digits are accounted for in this calculation, so the ratio is above one. The "value" of a first digit decreases as the numbers get large, because there are more digits.
For example, the numbers between 10 and 19 all start with a 1, adding ten "1"s to the count, plus one "1" for the number 11 and one "0" for the number 10. That leaves twelve "1"s and one "0", a ratio of 12:1. However, if we look at the numbers between 100 and 199, there are 100 "1"s added due to first digits, then ten "1"s and ten "0"s added because of second digits, and then ten "1"s and ten "0"s added because of third digits. This leaves a ratio of 120:20, or 6:1. So we can see that as the numbers get larger, although the number of ones will infinitely outpace the number of zeros, the ratio will approach 1, as the "value" of the first digits decreases and more digits "drown them out".
If you want to take the analysis one step further, you can also see sharp dips along the entire curve. I believe these are caused by sets of numbers beginning with 1 ending. If we look at x=.2 (1e10), we can see a sharp dip that starts exactly at x=.2 (1e10). This is because from 1 billion to 2 billion (x=.1 1e10 to x=.2 1e10), all the numbers begin with a 1, so there is a huge upward spike. This ratio balances out as we hit the 2 billion to 3 billion range, when the numbers no longer start with 1. In addition, I believe the immediate downward spike is because we hit the values 2,000,000 to 2,099,999, which all essentially have a "starting 0" in the second place. This causes a sharp decrease in the ratio. We can then see a bit of a recovery right after, as we hit 2,100,000 to 2,199,999, sending the ratio back up a bit as the ones recover. It then continues to decay, as there isn't another significant set of numbers that all begin with a "1". If you look closely, you can see mini dips and recoveries along the steady decreases, smaller versions of what I've explained here.
This is a super complex and hard to understand theory, so feel free to reach out on any of the social channels in the About section. I'd love to explain it more. I could talk about this for hours.